From Reefs Magazine
by Rich Ross and Chris Jury
The Editors Note: In Skeptical Reefkeeping IX, Rich Ross is joined by our old friend Chris Jury as they try to come to terms with the “impossible” yet confirmed PO4 readings in Rich’s gorgeous reef. The analysis is thorough, thought- provoking, grounded in science and suggestive of a far more complex picture regarding PO4 and its role in our aquariums.
There are many standard parameters in the reefkeeping world that aquarists strive to match in their home reefs – water quality, light spectrum and intensity, and water flow, just to name a few. Rarely do we stop to think where these standard parameters come from, and even more rarely do we consider calling into question the utility of these parameters. This can lead to aquarists ‘chasing numbers’; tweaking water parameters to hit a standard goal. Often times, people think that hitting a magic number will inherently result in a better, healthier tank. In the past few years, dealing with phosphate in saltwater aquariums has become one of the most talked about ‘must control at all costs’ parameter, and in this installment of Skeptical Reefkeeping, we will look at some evidence which calls into question the reliability of testing, the generally accepted target phosphate concentration, and general control of phosphate in reef aquariums.
Skepticism is a method, not a position. Officially, it can be defined as a method of intellectual caution and suspended judgment. As a Skeptical Reefkeeper, you decide what is best for you, your animals, and your wallet based upon critical thinking: not just because you heard someone else say it. The goal of this series of articles is not to provide you with reef recipes or to tell you which ideas are flat out wrong or which products really do what they say they do or which claims or which expert to believe – the goal is to help you make those kinds of determinations for yourself while developing your saltwater expertise in the face of sometimes overwhelming, conflicting advice.
Chasing Numbers
Sometimes reefkeepers fall into the trap of ‘chasing numbers’ – trying to adjust water quality to reach a goldilocks zone. A major problem with this approach is that it requires an aquarist to make nearly constant alterations to water quality based on small derivations from the standard parameter ‘set point’; often these alteration are performed manually by the addition of buffers, additives and potions. With such a high maintenance methodology, sooner or later something tends to go wrong – such as an accidental overdose of some chemical to the aquarium, which then leads to a cascade of far more serious problems. However, precise control over many water quality parameters in an aquarium is both unnecessary and impossible given the inherent imprecision associated with normal, hobbyist test kits. For instance, it makes little sense to spend time and money trying to lower your phosphate reading from 0.06 to 0.05 ppm, partly because the effective difference between the two numbers is so small, but more importantly, chasing numbers can be problematic because of the inherent limitations in testing methodology; it is quite possible that the 0.05 and the 0.06 ppm results could come from water samples with literally the same phosphate concentration. .
The test kits that are available to the home aquarist, and other testing methodologies for that matter, have inherent limitations in both their accuracy and precision, and are only as reliable as the techniques used by the person running the test. It makes a big difference to the result if you measure water levels in the test kit vials from the base of the meniscus or from the top of the meniscus. It makes a big difference if you measure the amount of reagent in the dosing syringe from the top of the plunger or the bottom of the plunger. It makes a big difference as to when you determine the titration end point. During a titration, do you assume that you’ve reached the end point when you see the testing sample change color? Start to change color? Stabilize to the changed color? It makes a big difference to the test results that the tests are run using the same techniques every time, as small changes in methodology can substantially impact the final test result. There are many variables in testing your water, so be methodical and follow the test kit instructions as closely as possible, and do all your testing the same way every time to minimize artifacts and procedural errors.
Precision and Accuracy
Even when great care is taken by the person using the test kit, there are inherent limitations to any and every testing methodology, and many of our test kits are simply not as accurate or precise as we might assume them to be. Let’s first consider what is meant by the terms ‘precision’ and ‘accuracy’. Precision is defined as how reproducible results of one test are relative to others. That is, if we test the same water using the same test kit, do we get about the same number every time, or do we get a wide range of variation each time we use the kit? Accuracy is defined as how close we come to the true value with our test kit. Using a realistic aquarium example, we could imagine some sea water which has a magnesium concentration of exactly 1300 ppm. Let’s say we use a test kit to determine the magnesium concentration of this sea water three times and we get values of 1150, 1160, 1145 ppm. The test kit is fairly precise, but it’s not very accurate since the average of these three values is 1152 ppm, which is not very close to the true value of 1300 ppm. Conversely, if we get values of 1100, 1250, 1500 ppm, the average of these three gives us 1283 ppm, which is close to the true value of 1300 ppm, so the kit is relatively accurate, but not very precise. Ideally, we want our test kits to be both as accurate and precise as possible.
Given the inherent uncertainties of our test kits, and a degree of variation from the user, most hobbyist grade test kits will have an uncertainty (i.e., a likely range of error) on the order of at least 5-10% of the value being measured, and much higher in some situations. If we were to measure the magnesium concentration of sea water which has a true concentration of 1300 ppm using a good-quality hobbyist grade kit we could easily get values ranging from 1200-1400 ppm during any individual titration (i.e., an error of 7.7%, or ±3.8% around the average). Of course, the magnesium concentration isn’t really changing in the sea water as we take samples to run titrations. Instead, we are getting variation in our test results because of the uncertainty of the test kit. If we factor in user error, this uncertainty could become far more significant. For example, what might happen if a person were to slightly but consistently add too little water to the test kit vial? Instead of getting an average magnesium concentration of 1300 ppm, with a range of 1200-1400 ppm for individual tests, they might end up with an average of only 1100 ppm with a range of 1000-1200 ppm. An aquarist might target 1300 ppm Mg2+ in their aquarium—close to natural sea water—and, if they are chasing numbers, start to make adjustments if the magnesium concentration deviates by more than 50 ppm. Hence, this person could end up making very frequent, small adjustments to their aquarium, driving himself or herself crazy, and eventually make some sort of major mistake which negatively affects his or her tank not because these adjustments were needed, but simply because this person was putting too much confidence in the numbers they were getting from their test kits.
Look for Trends, not Specifics
Make no mistake, it is often both useful and necessary to measure a variety of the water quality parameters in an aquarium using test kits. However, problems can arise if we fail to recognize that these test kits report only approximate values for these parameters, and those approximate values inherently come with a degree of error, including random variation. Going back to our magnesium concentration example above: an aquarist might obtain magnesium concentrations with their test kit of 1380, 1230, 1300 ppm in successive weeks and wonder why there has been so much variation in their tank when, in reality, the magnesium concentration was stable at 1300 ppm the entire three week period. In this case the apparent variation from week to week is an artifact, not real. Conversely, a person might get values of 1300, 1280, 1320 ppm in successive weeks and conclude the magnesium concentration has been relatively stable in the tank, when in reality the concentration slowly dropped from 1330 to 1270 ppm over these three weeks. In both cases, the true range of variation (or lack thereof) is simply too small to accurately detect by running a few tests.
If you run a water test for phosphate level twice with the same water, it is unlikely you are going to get the exact same result both times. First you might get 0.05 ppm, second you might get 0.06 ppm – so which one can you trust? Some reefkeepers will retest a water sample if they initially get a result that they don’t like, and will keep testing until they get one they do like. However, the flipside is often not true – people tend not to retest a sample when they get an initial reading that they do like. This is called conformation bias, looking for the result you already want, and it is a pitfall to avoid because the result has been chosen rather than determined.
Be careful about thinking your test results are overly accurate or precise – instead use them to look at general trends and to obtain rough estimates of the parameters of interest instead of trying to nail numbers. Something to try at home – run the same water sample three or four different times being sure to use the same techniques you really use when you test your water (e.g., don’t stop a titration early or extend it beyond the end point to match the results you got in your previous test) and see what results you get.
0.05 ppm, the Magic Number for Phosphate
People have been shooting for 0.05 ppm or less as a level to keep their tank phosphate concentration, and this number is often cited as the concentration on natural coral reefs. Interestingly, the reality is that the PO43- * of natural seawater varies significantly on coral reefs in different locations. The worry has become that with PO43- levels above 0.05 ppm, algae will take over an aquarium, stony corals will become weak and brittle and will grow slowly, and that if your phosphate levels are high, your reef is in mortal danger. Over the past 5-10 years we have seen an explosion in the amount of phosphate removing methodologies, but what is unclear is if spending time and money battling phosphate inherently results in a better reef?

What is Natural?
On natural coral reefs, the phosphate concentration can vary substantially from location to location depending on several factors. For most coral reefs the typical phosphate concentration is on the order of 0.05-0.3 µM (micromolar—the unit of measure normally used in the sciences), or about 0.005-0.03 ppm (Kleypas et al., 1999; Szmant, 2002), which is in the same neighborhood as what is usually recommended for reef tanks. Using a hobbyist grade test kit, this level of phosphate would produce only a faint hint of blue in the test vial – or no hint at all, depending on one’s eyesight. However, values which are both much lower and much higher can be observed naturally on some coral reefs.
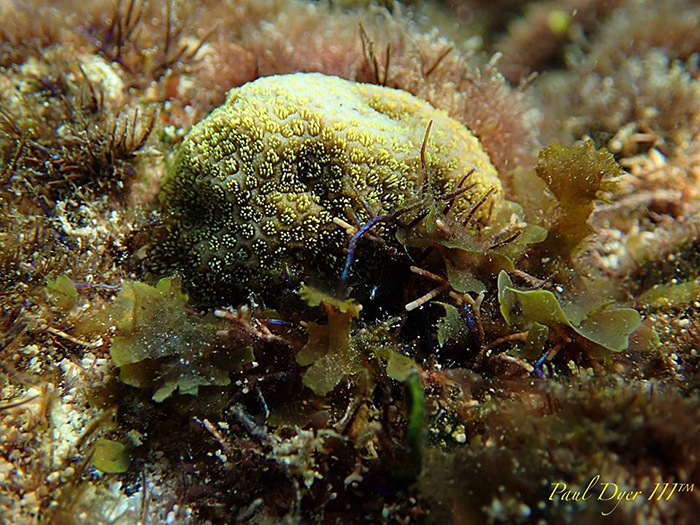
Corals and algae on coral reefs rapidly take up phosphate from the ambient sea water as it is available. In fact, it’s been shown that coral reefs tend to suck up phosphate as fast as it is physically possible to do so (Falter et al., 2004). In places like the barrier reef flat in Kāne‘ohe Bay, Hawai‘i—which is a very wide reef flat at about 1.5 miles (2.4 km) across—the reef is able to suck phosphate out of the water so effectively, it creates “ultra-oligotrophic” conditions as sea water passes over it (M. Atkinson, pers. comm.). Here it is not unusual to find phosphate concentrations at the very lower limit of scientific detection—on the order of 0.005-0.01 µM, or 0.0005-0.001 ppm. This is a much lower phosphate concentration than can possibly be detected using hobbyist grade test kits. In fact, it would take 10-50 times this concentration just to start getting a faint hint of blue in the test vial of a hobbyist grade kit. It is possible to achieve phosphate concentrations this low in a reef aquarium (Wiedenmann et al., 2013), but it’s impossible to detect the concentration much below 0.03 ppm using a hobbyist grade kit.
Now let’s consider the other side of the coin: phosphate concentrations on naturally high-nutrient reefs. Most high-nutrient coral reefs occur in areas of upwelling, especially those in the Eastern Tropical Pacific, the Central Pacific, near the equator, the Arabian Sea, and a few other locations. Deep, oceanic water is naturally much higher in nutrients than most surface sea water. When there is upwelling in nature it delivers a large supply of nutrients (including phosphate) into shallow water. On these reefs a typical phosphate concentration might be on the order of 0.3-0.5 µM, or about 0.03-0.05 ppm, but phosphate concentration can occasionally reach values of 0.9 µM (0.09 ppm) and even as high as 1.5 µM (0.15 ppm) for short periods of time (Szmant, 2002). These aren’t necessarily what we would consider “high” phosphate concentrations in an aquarium, but nonetheless they are at or above the typically recommended limit for phosphate in a reef aquarium. One might initially assume that these reefs should be in very poor condition, choked by algae, yet some of them are among the healthiest in the world. This good health is likely at least partly related to the fact that these reefs are very remote and receive few direct, human impacts (Sandin et al., 2008).
Elevated Phosphate on Wild Coral Reefs: An Emerging Picture
Make no mistake, one of the most effective ways to damage or destroy a coral reef in nature is to dump a bunch of nutrients on in, including phosphate. The classic example of the effects of nutrient enrichment on coral reefs comes from Kāne‘ohe Bay, Hawai‘i (reviewed by Hunter and Evans, 1995). Following World War II the population of Kāne‘ohe, HI and areas surrounding Kāne‘ohe Bay increased from just a few thousand people to tens of thousands (currently ~35,000 people in Kāne‘ohe town, with several thousand more in nearby areas). Along with this population increase came rapid development of the watersheds feeding into the Bay. Following WWII and until the late 1970’s, the sewage from Kāne‘ohe and from the nearby Marine Corps Base Hawai‘i was dumped directly into southern Kāne‘ohe Bay. Over the course of a few decades the reefs in the southern part of the Bay were severely damaged. On the order of 90-99% of the coral that lived there prior to WWII simply died off and was replaced by various filter-feeding and deposit-feeding invertebrates and algae. In the central part of the Bay, further from the sewage input, the reefs became severely overgrown by the bubble algae Dictyosphaeria cavernosa, which choked out and grew right over the corals. It was only in the northern portion of the Bay, several miles away from the sewage input and better flushed by the open ocean, that the reefs remained relatively healthy. Due to growing concerns of the impacts of sewage input, the sewage outfalls were moved from the Bay to deep, offshore water in 1978/79. Over the following 30 years the reefs showed a dramatic level of recovery. Slowly but surely, the algae and invertebrates which had smothered the corals and occupied space began to die out and the corals regrew and successfully reproduced. Today, more than 40 years after the sewage diversion, the coral cover (that is, the portion of the reefs covered by live coral) has increased from as little as 1-2% in the 1970’s to 50-90% on many of these reefs, which is similar to coral cover in the little-impacted northern part of the Bay. There are other examples of the negative effects of nutrient enrichment on coral reefs, but this is perhaps the clearest. Adding a lot of extra nutrients (including phosphate) to the reefs nearly killed them. Removing those stressors allowed the reefs to recover, though not all coral reefs impacted by excess nutrients have been so lucky.
Prior to the sewage diversion, the phosphate concentration averaged across Kāne‘ohe Bay was about 0.3 µM, or about 0.03 ppm, but reached about 0.9 µM or 0.09 ppm in the heavily-impacted southern part of the Bay. Following the diversion the Bay-wide average phosphate concentration dropped to about 0.1 µM, or about 0.01 ppm, and a maximum of about 0.2 µM, or about 0.02 ppm. This is remarkable in the context of the phosphate concentrations observed on other coral reefs. During the period of sewage discharge to the Bay phosphate concentrations rose to levels observed on naturally high-nutrient reefs, and the reefs in the Bay were devastated. Following the diversion phosphate concentrations dropped to levels typical on most coral reefs, and the reefs in the Bay began to recover. Hence, it appears that absolute phosphate concentration is only one piece of the puzzle and the context in which a particular concentration occurs is also very important.
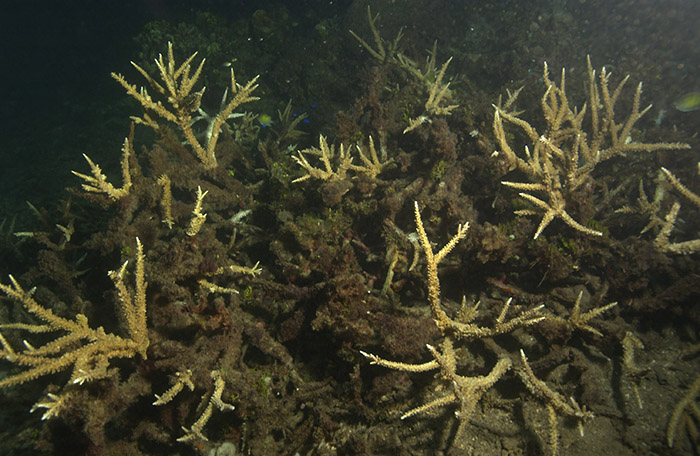
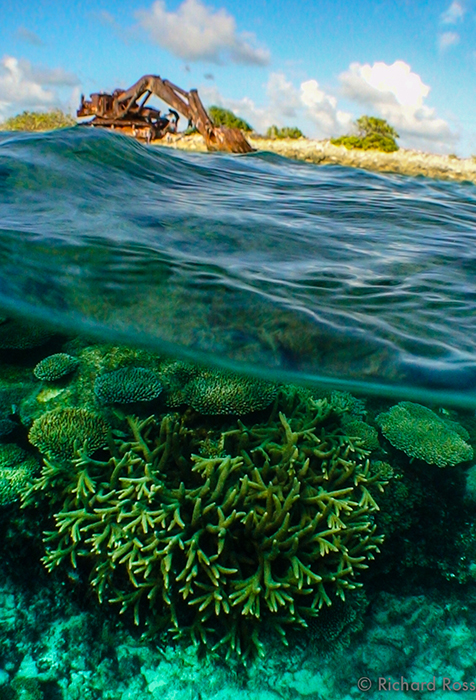
Now consider the case of the recently reported “black reefs” (Kelly et al., 2012). The Line Islands straddle the equator, due south of Hawai‘i. Due to equatorial upwelling, many of these reefs fall into the category of high-nutrient reefs, yet the more remote of these reefs are very healthy. At Kingman Atoll, Millennium Reef, and Tabuaeran Island there are some old ship wrecks. Within the vicinity of the wrecks the reefs have been utterly transformed. Rather than dense, healthy corals the reefs are covered by cyanobacteria, other algae, and detritus. Many of the corals that remain in these areas are diseased, and dying. The equatorial upwelling zone is one of the so-called high nutrient, low chlorophyll regions of the ocean. That is, you’d expect there to be a lot more algal growth in this region because of the elevated nutrients than what is actually observed. What has been shown convincingly is that many of these regions have relatively modest amounts of algae because there is insufficient available iron, which is a critical micronutrient. Hence, the algae in these regions can’t grow overly fast in spite of the high nutrients, including phosphate, because there is not enough iron. What are these wrecked ships made of? Bingo, you guessed it: iron.

It appears that elevated nutrients, including phosphate, are not a problem for the reefs, as long as algal growth and disease-causing microbes are limited by some other factor—in this case, the availability of iron. When the iron limitation is alleviated the reefs respond to the high nutrients in much the same way as those in Kāne‘ohe Bay: the corals die and other organisms take over. The emerging picture on natural coral reefs is that excessive nutrient enrichment can severely damage a reef, but the effects depend on the context in which that enrichment occurs. What is safe for one coral reef could be enough to destroy another. The negative effects can also be largely indirect. That is, it is not necessarily clear from observations of whole coral reefs whether elevated nutrients (including phosphate) directly harm corals, but they can certainly be killed off if algae and microbes go bananas from excessive nutrient availability.
Elevated Phosphate and Corals: Do We Know What We Think We Know?

Looking at the anecdoteal reports available, we might think that tanks with high phosphate will be algae gardens and that SPS corals kept in such tanks will become so fragile that they will turn to chalk dust at the slightest touch. Some people say that their algae problems went away when they lowered the phosphate level in their aquarium, however, many of these tanks are also young and could easily be working through one of the many cycles that captive reefs experience. It may be the case that the algae issues would have resolved themselves without the phosphate level changes. In this case, however, we have more than just anecdote to work with.
Early studies of the effects of nutrient enrichment (including phosphate enrichment) on corals generally found that increased nutrient supply led to reduced coral growth rates. A number of hypotheses were generated to explain why, with mixed levels of support. For phosphate in particular, it is known that phosphate ions can interact with calcium carbonate crystals in such a way that they disrupt the structure of the growing crystal, and are said to “poison” the surface. Some hypothesized that elevated phosphate concentration could reduce coral growth rates by poisoning crystal growth as the corals worked to form their skeletons, and at least some of the early work in this area appeared to be consistent with the hypothesis.
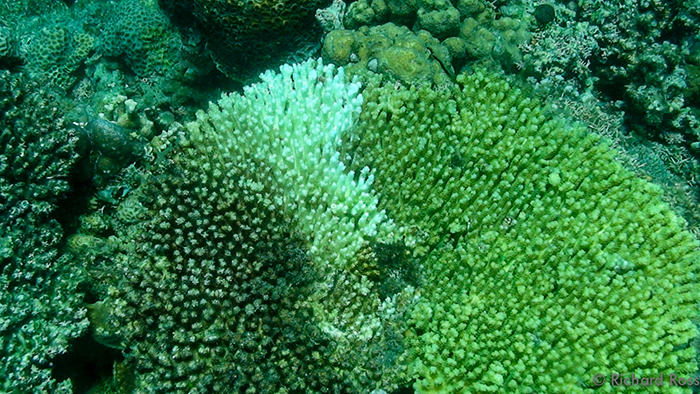
In the mid-1990’s the ENCORE project (Effects of Nutrient enrichment on COral REefs) was conducted on the Great Barrier Reef (Koop et al., 2001). This experiment consisted of dosing concentrated solutions of ammonium and phosphate salts to coral microatolls at low tide over a 2 year timeframe, and assessing a large variety of responses by the various reef organisms. A variety of subtle, negative impacts were found under nutrient enrichment, but many response variables did not respond in the ways which were expected. In particular, under phosphate enrichment several coral species experienced higher growth rates. Hmmm… Skeletal micro-density also tended to increase slightly at branch tips for Acropora longicyanthis under phosphate enrichment, though bulk skeletal density tended to decreases slightly. Hmmm… Based on earlier work, and based on what we thought we knew about the effects of phosphate on coral growth, these results were not at all what was expected.
Two other recent studies have really begun to blow the lid off of what we thought we knew about the effects of elevated phosphate on corals. Godinot et al. (2011) examined the effects of phosphate concentration (0.00, 0.05, and 0.25 ppm) on growth and various physiological responses of the coralStylophora pistillata. Similarly, Dunn et al. (2012) examined the effects of phosphate enrichment (0.09, 0.2, and 0.5 ppm) on the coral Acropora muricata. Both of these studies were performed in aquaria where at least some of the negative, indirect effects of nutrient enrichment which can occur on a real coral reef, such as algal overgrowth, could be minimized. Surprisingly, in both studies the corals grew fastest at the highest phosphate concentrations tested (0.25 and 0.5 ppm, respectively). In fact, the rate of coral growth for both species increased linearly with the phosphate concentration. At least for A. muricata, skeletal density was also lowest for the rapidly-growing corals in the high phosphate concentration, though reduced skeletal density during periods of rapid growth is common for many corals. Hence, these corals were growing fastest and appeared to be “happier” at phosphate concentrations on the order of 5-10x greater than the commonly recommended upper limit for reef tanks, or about 10-50x the phosphate concentration typically observed on most coral reefs.
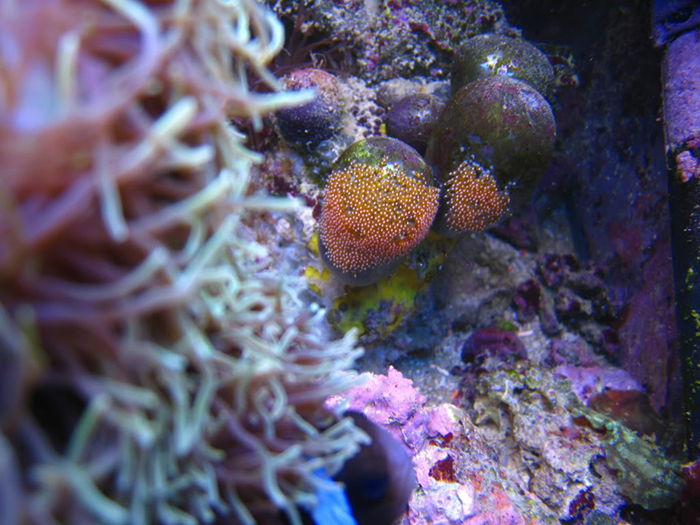
On a natural coral reef it is almost impossible to achieve nutrient concentrations this high without also turning the reef into a swamp, choked by algae and full of detritus. However, in captivity it is possible to have higher phosphate concentrations than typically occur in nature while at the same time preventing algal overgrowth and many of the other negative, indirect effects of elevated nutrients on corals. Under these elevated phosphate conditions, but in the absence of indirect stressors, at least some corals (and probably most of them) grow faster and perform “better” than they do under low phosphate conditions.
Go ahead and say it with us: ho…ly…crap.
Case in Point
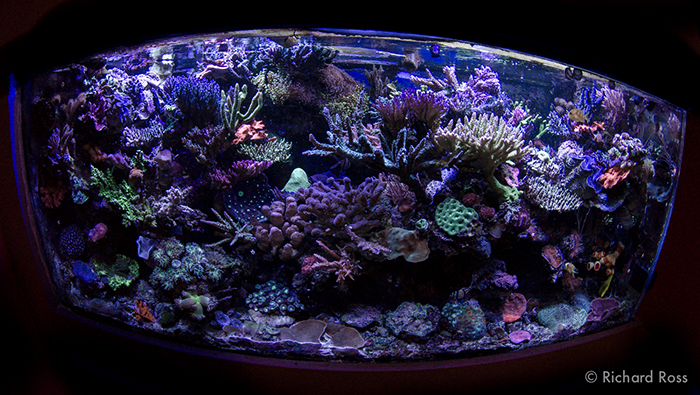
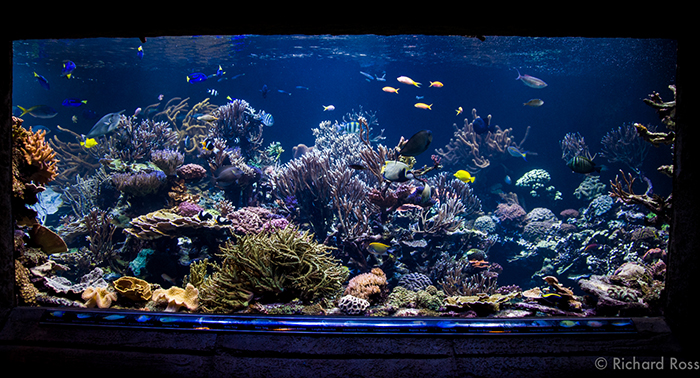
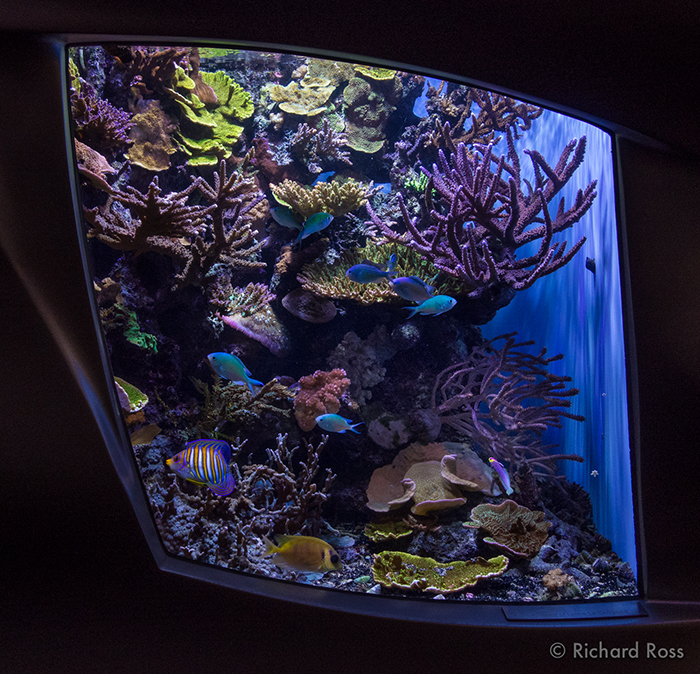
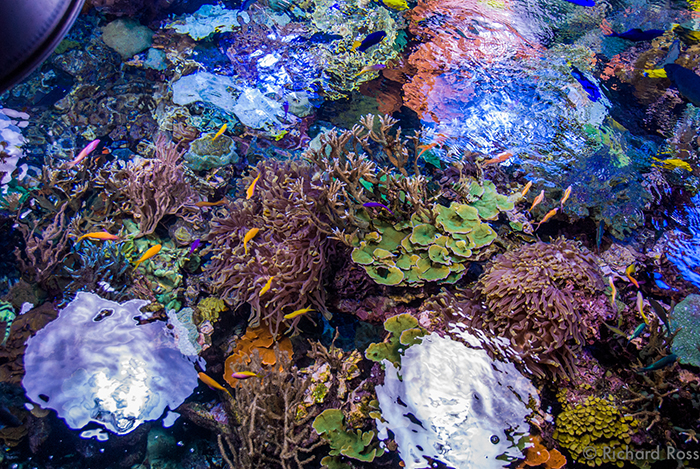
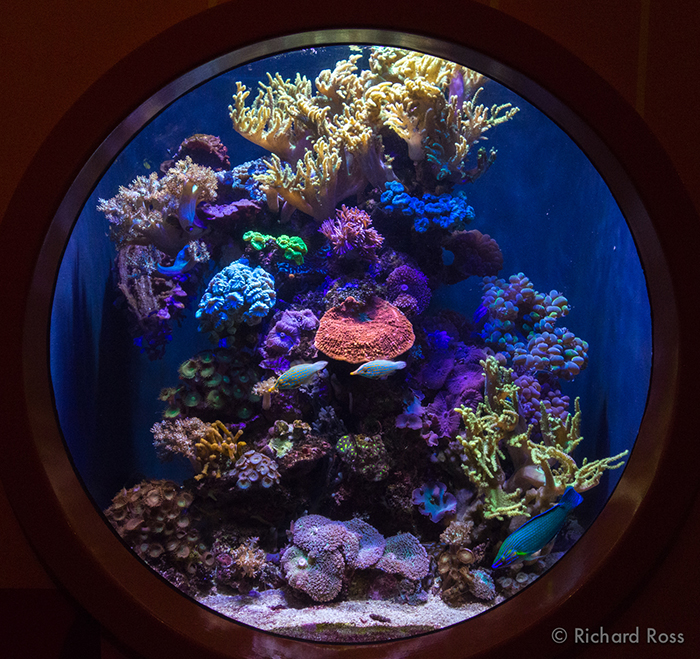
Rich’s tank, pictured at the beginning of this article is running a PO43- between 0.9 and 1.26 ppm at least for the last year.** Phosphate levels in this tank have been tested with a Hanna Checker, Salifert Phosphate test kit, Red Sea Phosphate test kit, and Aquarium Water Testing services. Water from this tank has also been tested at the Steinhart Aquarium in the California Academy of Sciences using the Hach ascorbic acid molybdate method. All testing methodologies produced results that were well within the same ballpark, with multiple tests performed over the last year. Concentrations of between 0.9 and 1.26 ppm are a whole lot higher than the hobby go to number for PO43- 0.05 ppm but clearly the corals are not suffering and algae has not taken over the system. We would expect at least some annoying algae growth at those levels, but there has been nothing significant. It may be that herbivores are effectively grazing the algae before it becomes a problem. It may be the case that low iron concentrations are limiting the growth of algae. It may be the dense coral cover is out competing the algae for real estate to grow on. It also may be something else entirely.
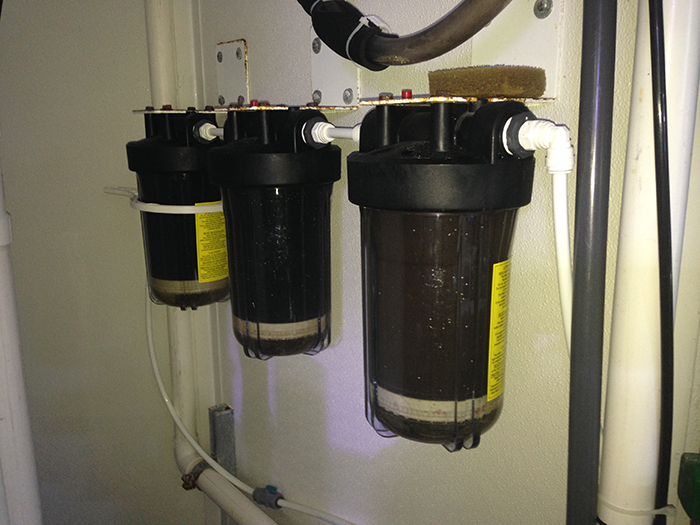
What we do know is the corals in this tank are healthy and growing, and experimenting to find out the details might have a detrimental effect on the system. For instance, if we start adding iron to the tank and the algae blooms, all the coral might get wiped out, and Rich is not sure he wants to take that risk. It might be the case that the corals would do just as well or better if the phosphate level of the system were lowered, though the studies discussed above suggests they might actually do worse. The bigger question becomes ‘how much time, effort and money is worth spending to bring the phosphate level down?’ Some options on the table include Granular Ferric Oxide, which can be expensive, Lanthanum Chloride, which can be expensive, or perhaps an algae turf scrubber which may turn out to be affordable over time. At some point some phosphate reducing methodology may be attempted, but as the old saying goes, if it ain’t broke don’t fix it. Since corals are doing just fine in spite of, or perhaps because of the high phosphate concentrations, Rich may just leave it as it is.
What We Are and Aren’t Saying
One of the things we are saying that it is important to understand is that the reality of water chemistry testing comes with inherent uncertainty, and that chasing numbers can be detrimental and not effective. Constantly tweaking water parameters can be detrimental to aquarium life, as well as costly.
In no way are we saying that everyone should run out and run reefs at high PO43- levels. We are simply not sure what is going on in these reefs with higher than ‘normal’ PO43- levels and any methodological changes need more understanding and support before they can be recommended. What we are saying is how wonderful it is that observations from aquairsts can make us take a long hard look at what we previously accepted as ‘figured out’. It may turn out that higher PO43- levels are not much of a big deal at all, or it may turn out that we will come to understand some previously unknown process in aquariums. Only time will tell, and it sure seems fantastic to be part of a living, breathing, changing scientific effort where skeptical thinking informs all sides of the process.
Notes:
* We can hear the confusion over the internets – “what the heck is PO43- ? Why not just write PO4? And while we are at it, what is the difference between organic and inorganic phosphate?”. These are great questions that are outside the scope of this article, however, Randy Holmes-Farley has written extensively about phosphate, and this article is a great place to starthttp://reefkeeping.com/issues/2006-09/rhf/
** The system has been set up for over 10 years, and you can read about some of the system details here: http://reefhobbyistmagazine.com/arch…3/pages/18.htm .
References:
Kleypas, JA, McManus, JW, Meñez, LAB.1999. Environmental limits to coral reef development: Where do we draw the line? American Zoologist. 39:146-159.
Szmant, A. 2001. Nutrient enrichment on coral reefs: Is it a major cause of coral reef decline? Estuaries. 25:743-766.
Falter, JL, Atkinson, MJ, Merrifield, MA. 2004. Mass-transfer limitation of nutrient uptake by a wave-dominated reef flat community. Limnology and Oeanography. 49:1820-1831.
Wiedenmann, J, D’Angelo, C, Smith, EG, Hunt, AN, Legiret, F-E, Postle, AD, Achterberg, EP. 2013. Nutrient enrichment can increase the susceptibility of reef corals to bleaching. Nature Climate Change. 3:160-164.
Sandin SA, Smith JE, DeMartini EE, Dinsdale EA, Donner SD, et al. (2008) Baselines and Degradation of Coral Reefs in the Northern Line Islands. PLoS ONE 3(2): e1548. doi:10.1371/journal.pone.0001548
Hunter, CL, Evans, CW. 1995. Coral reefs in Kaneohe Bay, Hawaii: Two centuries of Western influence and two decades of data. Bulletin of Marine Science. 57:501-515.
Kelly, LW, et al. 2012. Black reefs: iron-induced phase shifts on coral reefs. The ISMI Journal. 6:638-649.
Koop, K, et al. 2001. ENCORE: The effect of nutrient enrichment on coral reefs. Synthesis of results and conclusions. Marine Pollution Bulletin. 42:91-120.
Godinot, C, Ferrier-Pagès, C, Grover, R. 2011. Journal of Experimental Marine Biology and Ecology. 409:200-207.
Dunn, JG, Sammarco, PW, LaFleur Jr., G. 2012. Effects of phosphate on growth and skeletal density in the scleractinian coral Acropora muricata: A controlled experimental approach. Journal of Experimental Marine Biology and Ecology. 411:34-44
